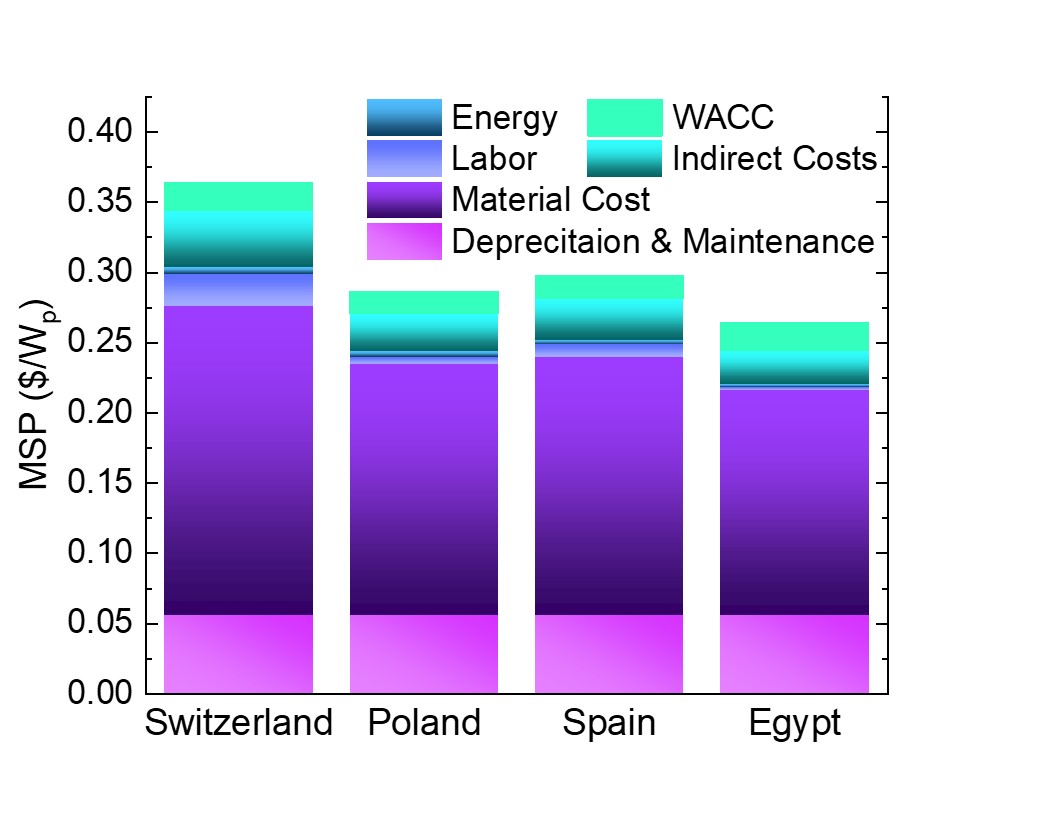
A column graph breaking down the individual elements of minimum sustainable price (MSP) at 20% PCE (Left) in Egypt, Spain, Poland and Switzerland and curves representing the relationship between MSP and PCE (Right)
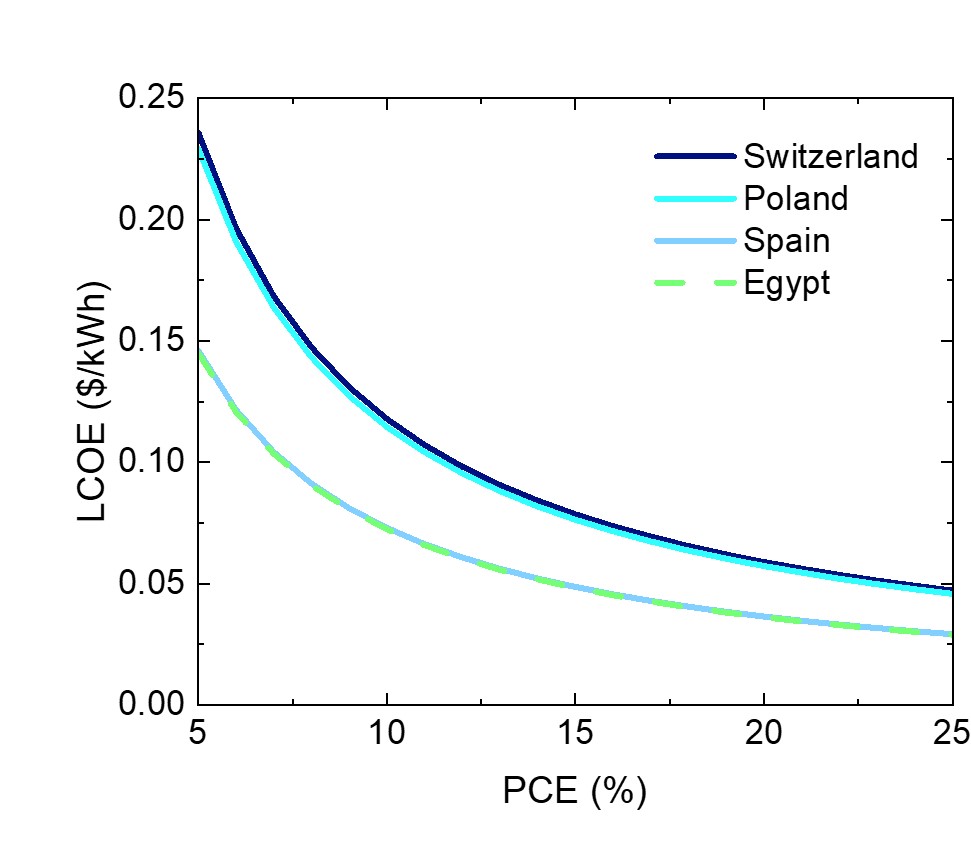
LCOE dependence on degradation rate (Left) and PCE (Right) based on production and installation costs in Switzerland, Poland, Spain and Egypt.
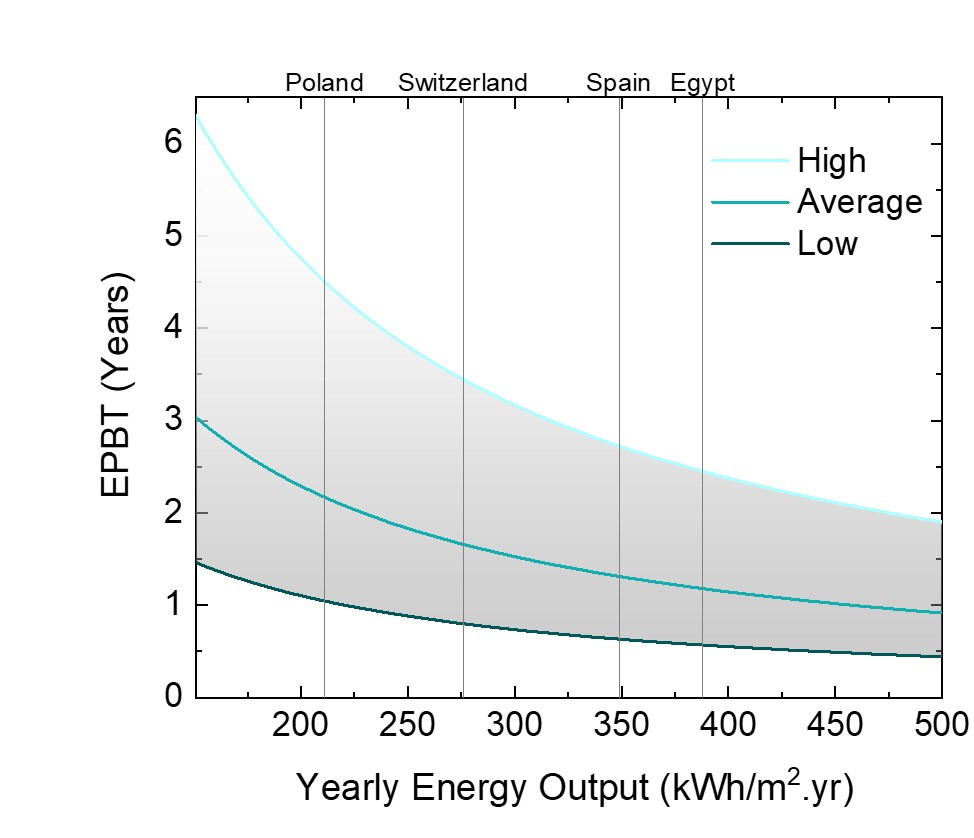
EPBT of perovskite solar panels without installation (Left) and with installation (Right). High and low curves represent the pessimistic and optimistic scenarios, respectively. The average curve is a geometric average of the two values.